
Month Summary for July
Here's a review of the crypto markets for July.

Summary
July was up for the most part. Some highlights:
Altcoins are outperforming: ETH was up ~50%, L1 assets up 14%; AI-theme assets are up +10% on average; DeFi up +18% on average for the month. DeFi added to TVL (total value locked) in July to $153b from $120b in May
We forecasted global M2 liquidity to continue to effect asset prices in July, which happened, that trend continues from April. We expect it should continue through August into September.
Trade war / tariffs can still affect asset prices short-term for days perhaps a week, but not medium-term or long-term.
In July, we printed our 4th month with falling growth and rising inflation forecast – this means a “Fall” print in our Economic Seasons model. We’ve updated our “top finder” to May 2026 peak bull model.
Month Summary
Market Performance
As of July, the cryptocurrency market continues to exhibit strength:
Bitcoin soared to new all-time highs in July—briefly touching around $123,000, with mid-month spikes near $125,000—before settling slightly lower after some profit-taking.
Ethereum (ETH) delivered a standout performance, surging approximately 50% over the month. This gain was driven by institutional interest, staking incentives, and growing treasury demand.
Thanks to strong momentum in major coins and regulatory tailwinds, the total crypto market capitalization vaulted past $4 trillion for the very first time.
Key Drivers
Several factors are influencing the crypto market's trajectory in July:
Spot Crypto ETF Inflows (July 2025)
Bitcoin (BTC): Spot BTC ETFs pulled in approximately $6.0 billion in net inflows during July—marking one of their largest monthly totals.
Ethereum (ETH): Spot ETH ETFs attracted around $5.43 billion in net inflows, a staggering ~369% increase over June.
Corporate Treasuries (as of July 2025) were a big story – companies are adding BTC and ETH to their balance sheets
Bitcoin Holdings: Public and private companies collectively acquired 107,082 BTC in July alone.
Ethereum Holdings: Corporate treasuries now hold approximately 966,304 ETH, valued at roughly $3.5 billion, a significant jump from under 116,000 ETH at end‑2024.
Regulatory Landscape, Market Structure & Liquidity
A major milestone: the U.S. Congress passed—and President Trump signed into law—the GENIUS Act (Guiding and Establishing National Innovation for U.S. Stablecoins Act) on July 18, 2025, the first federal stablecoin regulatory framework.
The SEC introduced a new policy initiative known as “Project Crypto”, aiming to modernize digital asset regulation, clarify asset classifications, and support integration of trading, staking, and lending services.
Crypto markets experienced renewed risk appetite and policy-driven stability. ETH sharply climbed as a treasury and yield asset, alongside robust ETF capital inflows.
Stablecoin inflows remained strong—up $8 billion in July, marking the second straight month of accelerated liquidity entering crypto markets.
Trading activity surged, with CME’s crypto product suite seeing a 140% year-over-year increase in average daily volume, reaching $10.5 billion.
Banana Zone
A Historic Breakout Fueled by Liquidity and Institutional Demand.
In the 4-5 year cycle that drives crypto, we get into the Banana Zone in the last phase of the cycle. As you can see there’s a repeating pattern each time. It’s happened in the past 3 cycles. This time around should be no different.
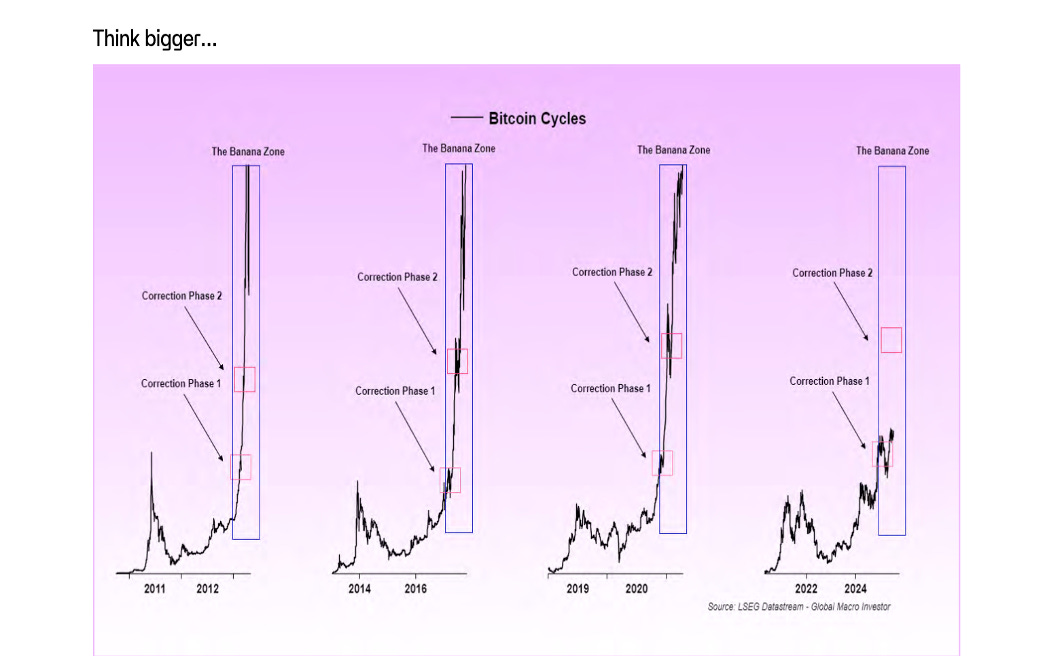
We have already gone through the Correction Phase 1 earlier this year. We expect to have one more big correction before entering the final phase. We will aim to protect the portfolio with some downside protection, but we don’t want to get caught offsides when the market truly rips higher. So, expect a final correction phase that could see a drawdown of 20% - 30%.
After that correction phase, comes the final phase that drives prices to their highest point in the cycle. This final phase is the Mania Phase of the Banana Zone. It’s the peak. Let’s not get spooked when we have one more correction phase before things really go wild.
Global Macro
Global M2 Liquidity
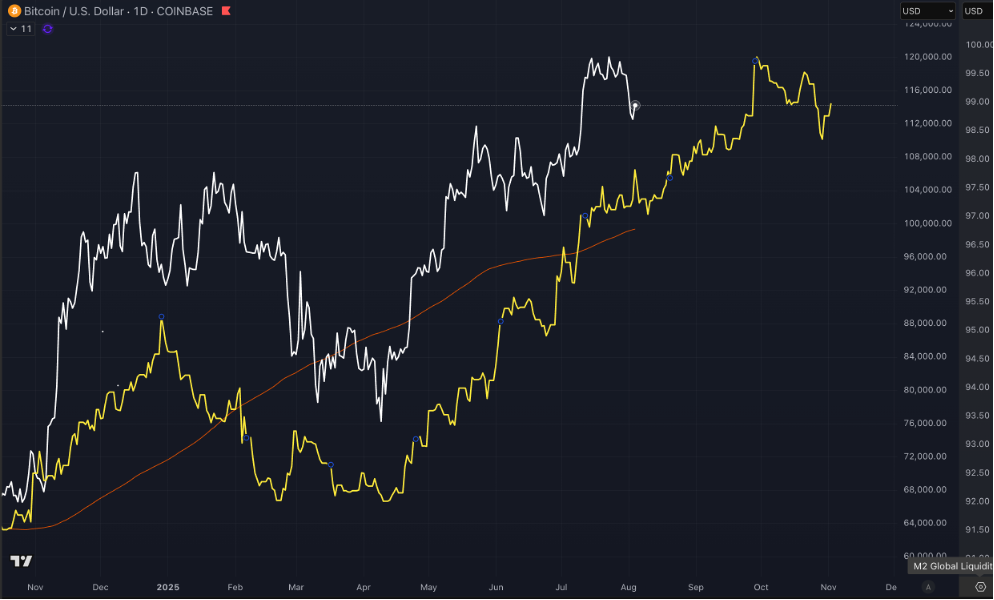
Global M2 Liquidity Overview (Mid-2025)
In July 2025, global liquidity continued to expand meaningfully, providing a powerful tailwind for crypto markets. The total global M2 money supply climbed to approximately $93.7 trillion, reflecting a 7.45% year-over-year increase. Over the past three months, global M2 rose about 3.87% in nominal U.S. dollar terms—a pace that exceeds historical norms and signals sustained monetary easing across major economies.
However, the picture was more mixed when adjusted for local currencies. Global M2 grew just 1.19% over the last three months in real local terms, with regional divergence: the U.S. posted a robust +1.68%, while the Eurozone trailed at +0.33%, hinting at uneven monetary conditions across jurisdictions.
Still, this net liquidity expansion was more than enough to drive investor confidence in risk assets—particularly crypto.
Bitcoin, and by extension crypto in general, has long demonstrated a strong positive correlation with global M2, responded in kind. Historically, Bitcoin has lagged behind global M2 shifts by around 90 days, and the mid-year liquidity swell that began in Q2 now appears to be bearing fruit. A custom Global M2 Liquidity Index—tracking monetary conditions across the U.S., Eurozone, Japan, and China—had already risen 5% since April, suggesting ample room for continued Bitcoin price appreciation into late Q3 and early Q4.
Indeed, July saw Bitcoin not only sustain its gains but break through all-time highs, briefly touching $125,000. Analysts now suggest that if liquidity trends hold, BTC could surge further, with projections ranging between $130,000 and $170,000 before year-end.
Beyond Bitcoin, altcoins also benefited sharply from domestic liquidity conditions—especially in the U.S., where M2 hit a record near $22 trillion. That represented a 4.5% annual growth rate, the fastest pace in nearly three years. This surge in U.S. money supply helped catalyze a pronounced “altseason” as capital rotated into higher-beta assets. Altcoins rallied by an average of 15% in July, fueled by over $200 million in fresh inflows, as investors chased yield and upside potential in the long tail of the crypto market.
The combination of global and U.S. monetary expansion created ideal conditions for crypto appreciation. Spot ETFs for both Bitcoin and Ethereum saw record-breaking inflows, and corporate treasuries deepened their exposure, particularly to ETH, which is increasingly viewed as a yield-bearing treasury asset.
Looking forward, the liquidity backdrop remains broadly supportive. As long as central banks maintain dovish stances and global M2 continues expanding, crypto markets are likely to retain their bullish tone. However, investors should remain alert to the risks of inflationary pressures or policy tightening, which could eventually temper the rally.
Other Metrics – Positive Trends Continue
The following metrics are within their thresholds and are setting the stage for the next anticipated leg of this bull run:
10-yr UST Interest Rate (< 4.8%): ending the month at 4.23% (✔)
DXY Index (<106): ending the month at 98.1 (✔)
MOVE Index (<140): ending the month at 84.6 (✔)
VIX Index (<20): ending the month 17.6 (✔)
This is the best global macro backdrop an investor can have with expanding global M2 liquidity and all 4 macro metrics under thresholds.
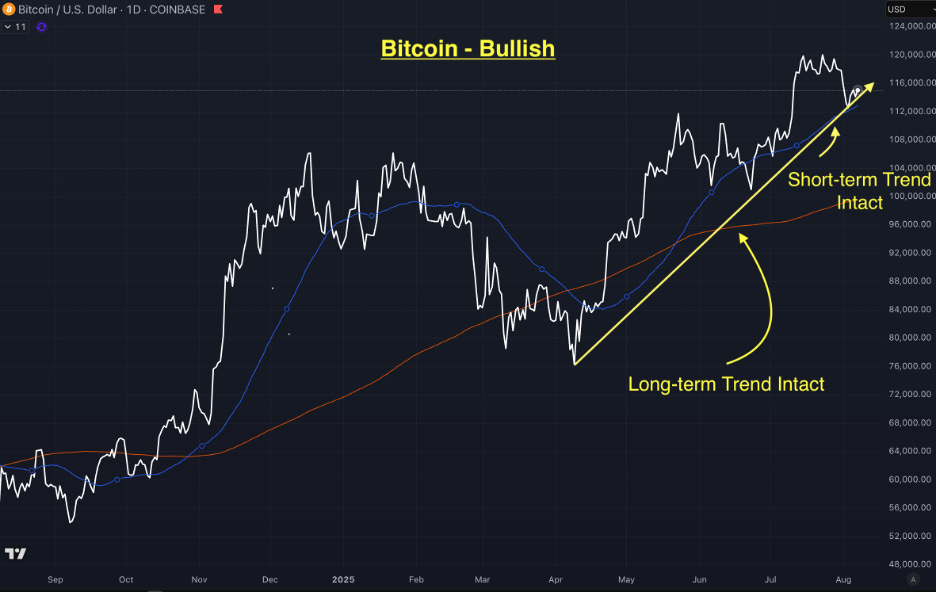
Bitcoin Chart - Bullish
Summary
July 2025 was a landmark month for Bitcoin, as the world’s largest cryptocurrency surged to fresh all-time highs on the back of rising global liquidity, record ETF inflows, and growing institutional adoption.
The month began with strong upward momentum, and by mid-July, Bitcoin had broken through the psychologically significant $120,000 level, ultimately peaking just above $125,000 before retracing slightly. This rally was not the result of speculative hype alone—it was grounded in macroeconomic tailwinds and a fundamental shift in how institutions are engaging with BTC.
A major driver of this surge was the continued expansion in global M2 money supply, which rose 7.45% year-over-year to roughly $93.7 trillion. Bitcoin has historically tracked liquidity expansion with a lag of about 90 days, and the market’s strong showing in July appears to reflect liquidity added in Q2. With central banks, especially in the U.S. and China, maintaining accommodative stances, monetary conditions remained highly supportive of risk assets. This backdrop provided a powerful macro impulse for Bitcoin’s advance.
In addition to liquidity, institutional inflows reached record levels. Spot Bitcoin ETFs pulled in around $6 billion in net inflows during the month, surpassing expectations and reinforcing Bitcoin’s status as a credible store of value for traditional portfolios. These flows came not just from retail but from pensions, sovereign wealth funds, and corporate treasuries. In fact, corporate buyers added more than 107,000 BTC in July alone, signaling growing conviction among CFOs and treasurers that Bitcoin deserves a place on the balance sheet.
The regulatory landscape also added fuel to the rally. The passage in the House and signing into Law of the GENIUS Act, the first comprehensive U.S. federal legislation for stablecoins and digital assets, removed a major overhang and encouraged broader participation from institutional capital. Confidence in regulatory clarity has long been cited as a prerequisite for large-scale adoption—and July marked real progress on that front.
Market structure dynamics reinforced the rally. Spot-driven momentum dominated the early part of the month, while futures open interest rose steadily without the excessive leverage that typically signals overheated conditions. On-chain activity also picked up, with wallet growth, active addresses, and transaction volume all trending higher.
As the month came to a close, Bitcoin was consolidating just under all-time highs, with signs of healthy profit-taking but no major reversal in trend. Analysts remain broadly bullish, with many targeting $130,000 to $170,000 in the months ahead if liquidity remains abundant and ETF inflows persist.
In short, July 2025 was a breakout month for Bitcoin—not just in terms of price, but in institutional acceptance, regulatory clarity, and macro tailwinds. We predicted this in our last quarterly report. It now sits not as a fringe asset, but increasingly as a core macro and treasury instrument, deeply embedded in the next generation of global finance. Importantly, altcoins had an even bigger month and this is the first indication of alt season.
In Closing
In July, we saw continue strength in crypto prices. Bitcoin put in a new ATH, as we predicted last month. While it didn’t hold throughout the month, we did end July with higher prices.
We are in the early stages of alt season. Ethereum massively outperformed Bitcoin in July which we said was a key indicator that alt season has begun. Investments in Ethereum and Hyperliquid helped outperform Bitcoin. In fact the liquid portion of the portfolio outperformed Bitcoin by 2.5x. Most other major crypto assets also outperformed Bitcoin. We expect this to continue into Fall.
Global M2 liquidity is providing the perfect backdrop for crypto investors. Though, tariffs are still a key risk to manage, they’re affecting the economy starting in August. We’ll need to see to what extent over the coming months, but growth is slowing and the chance for inflation is increasing.
This monetary expansion setup along with all the technological advancement happening with blockchain technology, is what will continue to drive crypto asset prices higher. We now estimate this bull run to continue to at least May 2026 based on metrics we’re following as our market “top finder” (see below).
We expect August to be a positive month. We’ll continue to monitor and allocate accordingly.
Happy Hunting,
Jake Ryan
CIO Tradecraft Capital
Author, Crypto Investing in the Age of Autonomy
Author, Crypto Decrypted
PS Our Crypto Cycle Top Finder - (Green) —— Target Top: May, 2026
GMI-TF - Green
BTC-MVRV - Green
Economic Seasons - Yellow
ISM - Green
Global M2 - Green