
2026: Crypto Winter?
When Macro Meets On-Chain: Reading the Quiet Signals Before a Crypto Market Top

In every cycle, the market peak doesn’t arrive roaring. It arrives whispering: subtle shifts in macro and on-chain behavior that most participants ignore until it’s too late.
For most of 2025, crypto observers have argued about narratives — halving, ETF flows, retail sentiment. But the real story is being written in macro liquidity, manufacturing momentum, valuation, and dominance rotation.
Below, we lay out the five key metrics we watch to understand when the market has moved from a constructive phase to a risk-management phase, and what the latest data is telling us right now.
Macro “Season” — Have We Entered Fall?
Traditional economic season models aren’t as widely reported as PMI figures, but the spirit of the metric is this:
Spring / Summer: liquidity and risk appetite expand
Fall: growth slows, risk appetite falters
Winter: contraction sets in
Today’s data suggest we are not in a classic expansion phase — but neither are we at a full contraction. Manufacturing activity in the U.S. has slipped back into contraction territory, with the ISM PMI remaining below the neutral 50 level after briefly crossing above it earlier this year. This suggests weakening underlying economic momentum rather than acceleration.
So while the market still prices in growth, the macro backdrop on balance looks more like late-cycle drift than mid-cycle strength — a subtle nudge toward “Fall.”
Current signal: 🔴 warning - are we going back to summer or staying in cycle?
2. ISM Manufacturing Index — Not Overheating Yet
One of the few hard numbers we have on the broader U.S. economy is the ISM Manufacturing PMI — a monthly snapshot of industrial activity.
Bullish narratives often focus on readings above 50 as growth, and above 60 as “overheating.” But in 2025, the PMI briefly touched above 50 before reverting into contraction, reflecting ongoing structural weakness.
What this means: We are not seeing the kind of sustained, overheated expansion (ISM > 60) that typically precedes late-cycle liquidity tightening.
Current signal: 🟠 not in red (no ISM ≥ 60) however under 50 is warning.
3. Global M2 Liquidity — Liquidity Still Growing But With Mixed Signals
Liquidity — especially global M2 money supply — is the silent engine behind risk assets.
In early 2025, researchers pointed out that global M2 was surging past prior highs (~$112T), and that Bitcoin’s price historically moved in step with this liquidity expansion.
However, short-term liquidity growth and its impact can oscillate. Analysts have also flagged periods where global M2 has flattened or contracted, which tends to herald risk asset weakness after a delay.
The key takeaway: Liquidity is currently still above long-term trend, but recent trends show flattening or contraction in certain regions.
Current signal: 🟢 near warning, but still expanding.
4. Bitcoin MVRV — On-Chain Valuation Is Approaching Extreme
One of the most powerful on-chain valuation metrics is Bitcoin’s Market Value to Realized Value (MVRV).
At cycle peaks, MVRV tends to blow past 3.5 — a sign that price has stretched far beyond the average cost basis of investors, and distribution pressure rises sharply.
Right now, data suggests that long-term holder MVRV sits around ~3.11, which is below the highest extremes of past cycles but well into lofty territory, especially compared to historical norms.
In other words: valuation risk is elevated but not yet at classic cycle-top exhaustion.
Threshold: 🔴 MVRV > 3.5
Current: 🟢 Current Bitcoin MVRV ~1.9
5. Bitcoin Dominance — Capital Rotation Underway
Bitcoin dominance — the share of total crypto market cap that BTC represents — is a window into where capital is flowing.
In a classic late cycle, capital shifts out of Bitcoin and into altcoins as risk appetite becomes indiscriminate.
Recent data from mid-2025 showed that altcoins had been gaining share versus Bitcoin at certain points, although BTC dominance remained well above the critical danger zone (<40%) and closer to historical mid-cycle levels (e.g., ~55% reported earlier in 2025). Comma
Current signal: 🟢 no red (still above danger threshold)
Pulling It Together: Where We Are Now
Here’s the distilled view, metric by metric:
Metric
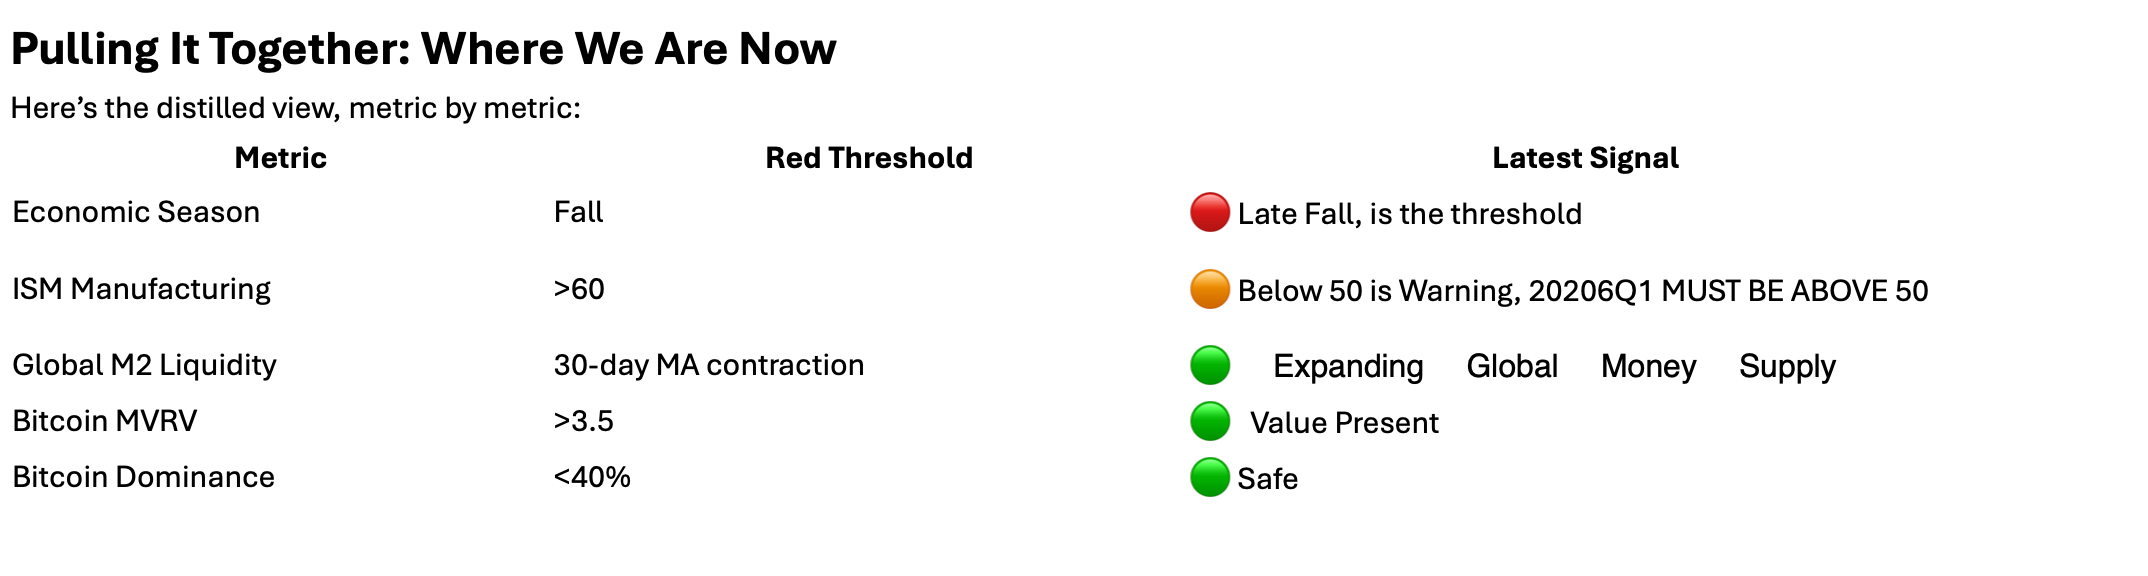
Overall picture: The market isn’t screaming “top” yet — but it’s quietly clustering toward caution. Multiple indicators are approaching risk thresholds without yet triggering them. We need to see expanding global money supply turn into economic activity.
Two Important Insights for Premium Readers
1. Macro and On-Chain Divergence Matters
The macro backdrop is weakening unevenly — manufacturing is soft, liquidity growth is mixed — while Bitcoin’s valuation metrics are creeping toward cycle-top levels. This divergence is often a hallmark of the late speculative phase, where narratives carry price beyond fundamentals, right before the reset.
2. Red is Not a Switch — It’s a Gradient
None of the metrics are in full red danger yet. But the trajectory matters. When multiple indicators shift toward red simultaneously, the probability of a sharp top increases.
In other words: the market feels more fragile now than at prior cycle peaks.
What Comes Next?
No one can declare a top weeks in advance with precision. But late-cycle risk is not some mystical endgame — it’s measurable.
Every top in crypto has come not during economic expansion, but during late-cycle conditions paired with stretched valuations and liquidity inflections.
Today’s framework suggests:
Macro momentum is weakening
Liquidity is plateauing
On-chain valuations need to see more blockchain transactions
Capital rotation is underway
That’s the quiet narrative before the crowd notices.
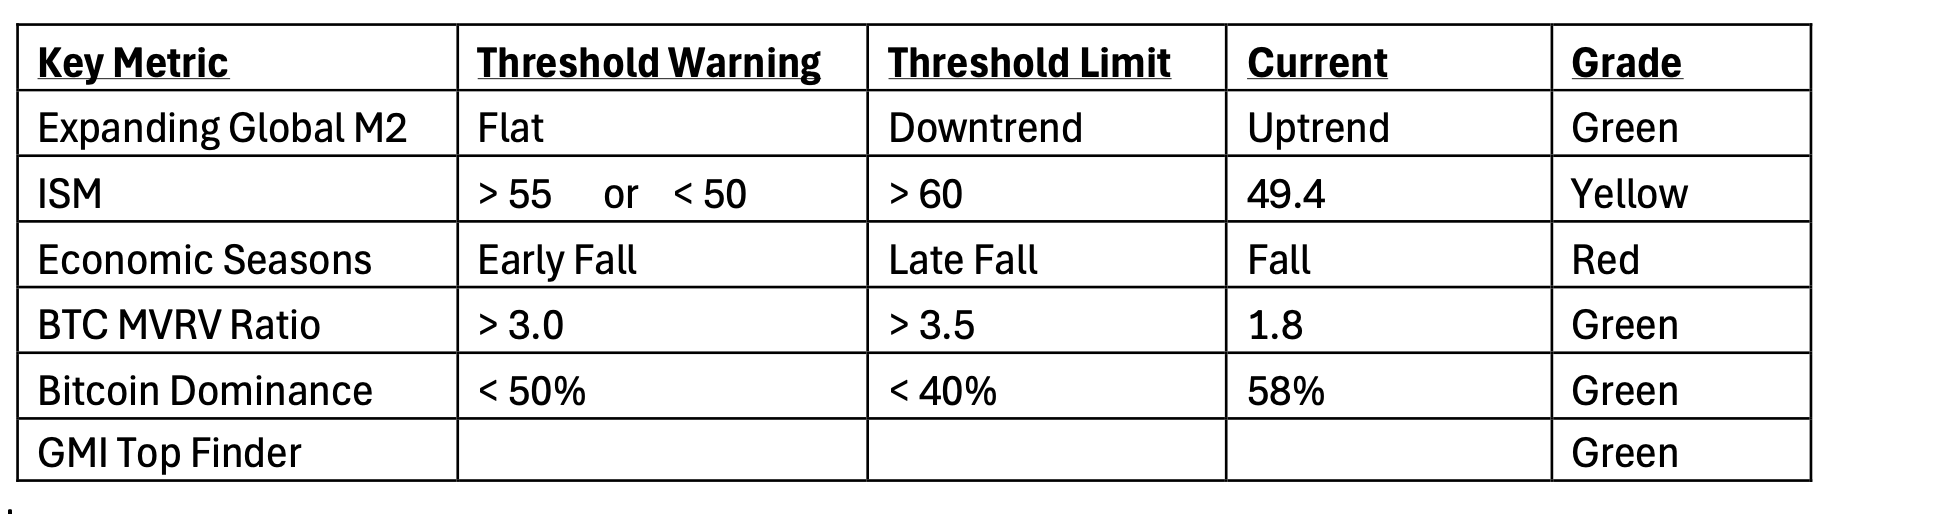
ARE WE ENTERING CRYPTO WINTER?
We are using 6 global metrics to help us gauge where the bull market “Top Finder” is. We are also watching other researcher and investors own top finders to see where we are in the cycle. Only 1 of our metrics is “flashing red.”
Here they are currently:
Key Metric:
Currently, the Fed cut rates in December and provided us with an updated “dot plot.” However, that’s almost irrelevant since Trump has promised to bring in a new Fed Chief in May who will cut rates and most likely announce the candidate by the end of January. Polymarket has a dovish Fed Chair candidate at 94%. That means the rate cutting cycle is going much longer than people are thinking.
Therefore, Global M2 Money Supply will be expanding for longer as well. They need this so they can roll the $8T of USTs from Covid that are coming due to maturity and need to roll them at the lowest possible rates. This should create growth which should push up the ISM metric and move us back to Summer/Fall in the Economic Seasons delaying the cycle.
This added liquidity will move into risk assets like it always does and push crypto prices higher. Remember, bitcoin is the asset most correlated to global M2 with an 83% correla@on. We should then also have an actual “alt season” which will push Bitcoin Dominance lower.
We’re currently in a trading range and need a catalyst to move higher. We could retest $85k in bitcoin and bounce. We could test the next lower major support level at $72k and that would be a retest of the current local all-@me low. But that needs to hold for the bull case to remain intact.
THIS IS KEY - In the past 10 years and 2 cycles, we’ve always had:
contracting global M2, ISM > 60
Late Fall for Economic Season
BTC MVRV Ra@o > 3.5
Bitcoin Dominnance < 40%
BEFORE we saw the market top and began our descent into crypto winter!
We aren’t close to any of that and that’s our case for why we’re in a super cycle and this is going much longer than people think.
What would change my position?
If ISM is not above 50 by Q1 2026
If Global M2 Money Index started to contract
If a “hawkish” Fed Chair was nominated
Otherwise, we’ve not seen the cycle highs just yet.
Happy Hunting,
Jake Ryan
CIO Tradecraft Capital
Author, Crypto Investing in the Age of Autonomy
Author, Crypto Decrypted